
Curious how much internet your household uses every day? Or want to make sure your connection speed matches your plan? You can check both yourself through the Pemakaian & Speed Test (Usage & Speed Test) menu in the GISNET Customer Portal.
Because all GISNET plans are unlimited with no FUP, these usage figures are for information only. There is no quota to run out and your speed is never reduced, no matter how much you use. The images in this article use a sample customer account.
How to Open the Usage & Speed Test Menu
- Log in to my.gis.net.id with your Customer ID and portal password.
- On the Home screen, tap the Speed Test button in the quick menu row, or tap Detail on the Pemakaian Bulan Ini (This Month's Usage) box.
Don't have a portal account yet? Contact the GISNET support team via WhatsApp at 0857-0629-9235.
Reading Your Internet Usage Data
The Pemakaian Internet (Internet Usage) section shows:
- Period options: 7 Days, 30 Days, or This Month.
- Total usage along with the daily average.
- Download: data you receive, for example when watching videos or opening websites.
- Upload: data you send, for example during video calls, when uploading photos, or from online CCTV recordings.
- Busiest day: the day with the highest usage.
- A daily chart, plus a per-day table if you tap Lihat tabel per hari (View daily table).
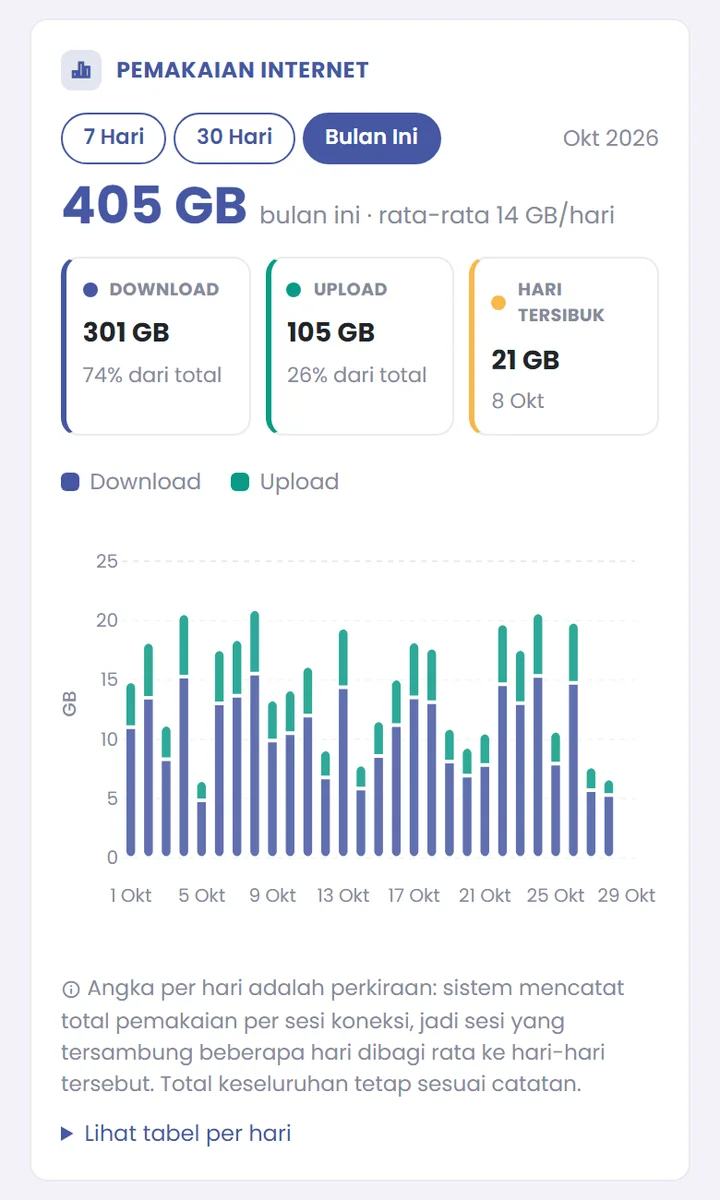
Daily figures are estimates. The system records usage per connection session, so a session that stays connected for several days is spread evenly across those days. The overall total still matches the records.
Tip: if usage suddenly spikes even though your household hasn't been using the internet much, check the Perangkat Terhubung (Connected Devices) list in the WiFi menu. See a device you don't recognize? Change your WiFi password right away. See how in the article how to change your WiFi password through the portal.
Running a Speed Test
Below the usage data is a Speed Test feature that measures your connection directly to the GISNET server. Tap Mulai Tes (Start Test), then wait until it finishes. The results include:
- Download and Upload: the speed of receiving and sending data, in Mbps.
- Ping: the round-trip time of data. The lower, the more responsive.
- Jitter: how stable the ping is. The lower, the more stable, which matters for video calls.
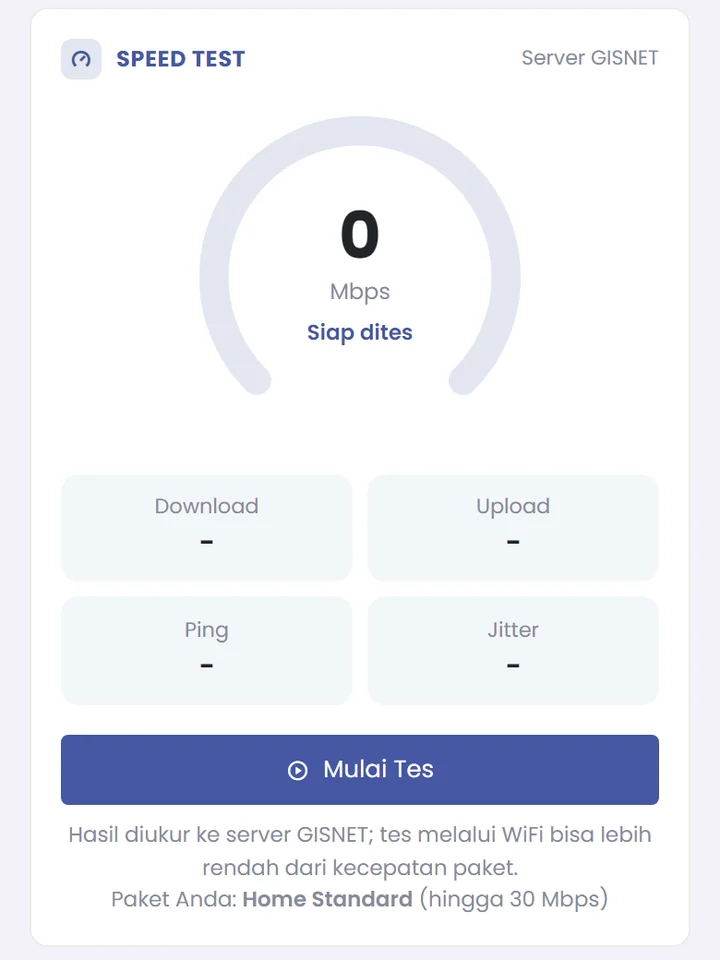
Below the test button, your plan and its speed are listed, so test results are easy to compare. GISNET plans are symmetrical, so upload should ideally be close to download. Also read the advantages of symmetrical internet.
Tips for Accurate Speed Test Results
- Use a LAN cable if possible. Tests over WiFi may be lower than your plan speed because they are affected by distance, walls, and signal interference.
- If you use WiFi, move your device close to the router and choose the 5 GHz network if available.
- Pause large downloads, streaming, or backups on other devices while the test is running.
- Repeat the test 2 to 3 times and look at the average.
Test results far below your plan even over a cable? Try restarting the router through the WiFi menu in the portal. If it's still low, contact the GISNET support team via WhatsApp at 0857-0629-9235. Our NOC team monitors the network 24 hours a day. More tips are in the article Slow home WiFi? 7 simple tips.
Not a GISNET Subscriber Yet?
Enjoy fiber internet that is unlimited with no FUP, with upload as fast as download and full IPv6. See our plans or check the coverage area.